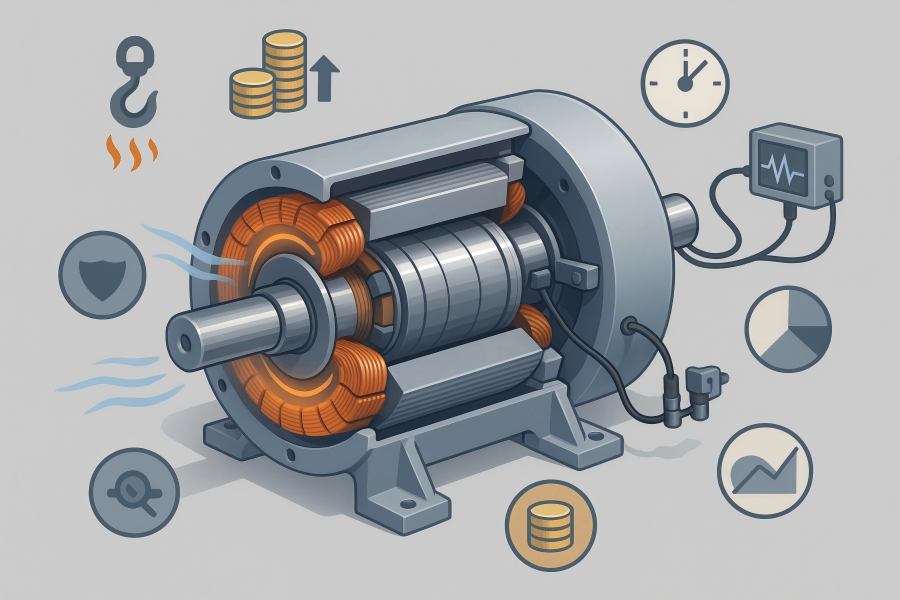
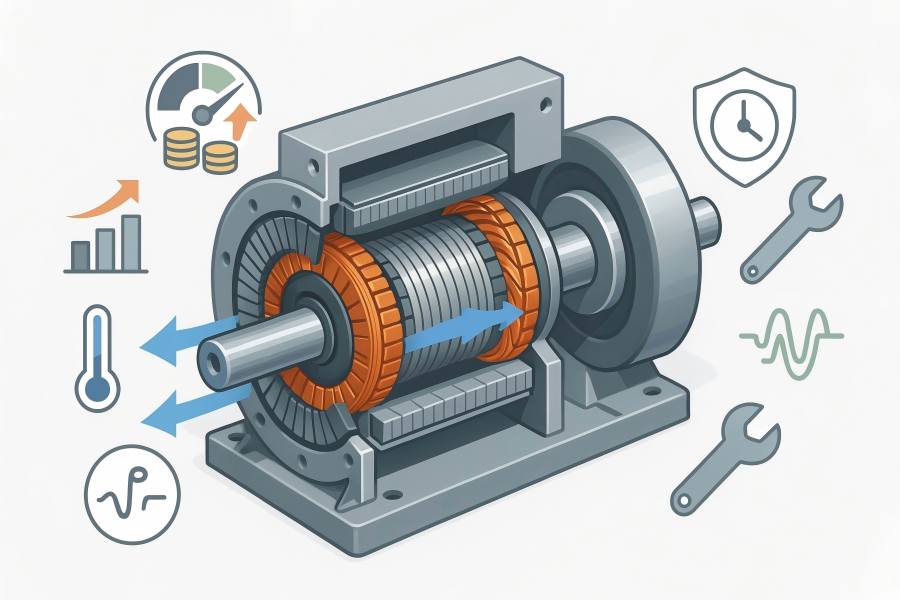
Industrial power systems hinge on uptime, efficiency, and predictable cost. In an alternator, generator stators and rotors drive most conversion losses, thermal stress, and lifecycle risk. Their materials (electrical steel, copper, magnets), winding geometry, insulation, and balance quality set baseline performance and cap reliability—shaping total cost of ownership and 10–20-year ROI.
Why stators and rotors dominate lifecycle economics
Conversion losses live in the active parts. In a synchronous or induction machine, the stator core and copper cause iron and I²R losses; the rotor adds copper (or magnet) losses plus eddy/sleeve effects. As the machine grows (hundreds of kW to multi‑MW), the efficiency delta between a “standard” and “premium” active‑part design commonly sits between 0.3–1.0 percentage points, which sounds small but compounds over thousands of operating hours per year.
Reliability is governed by the insulation system and mechanical integrity. Thermal class (F/H), resin system (VPI/trickle), slot liners, end‑winding bracing, and surge withstand drive how often you’ll rewind. On the rotor, retention sleeves, pole fixings, and balance grade (e.g., ISO 21940 G2.5) influence bearing life, vibration, and unplanned stoppages. For medium‑voltage units, partial‑discharge performance and end‑winding stabilization are primary determinants of life.
Uptime is money. In many facilities, a forced outage can cost $5,000–$50,000 per hour in lost throughput, scrap, and restart penalties. Small reductions in the probability of a rewind or catastrophic failure create outsized economic benefit—even when energy prices are low.
Typical cost composition (new 2–3 MVA synchronous generator)
Percentages vary by vendor and options, but a representative bill of materials for a wound‑field unit looks like this. The two line items that matter most to ROI—generator stators and rotors—typically represent ~55% of the alternator hardware cost.
| Subsystem (indicative) | Share of generator BOM |
| Stator core, windings, insulation, bracing | 34% |
| Rotor (body, field winding/magnets, sleeve, balance) | 22% |
| Frame & enclosure | 12% |
| Shaft & bearings | 8% |
| Cooling package (fans/ducts/HEs) | 7% |
| Testing & QA (incl. overspeed/balance) | 7% |
| Excitation & AVR (if wound-field) | 6% |
| Terminal box & power leads | 4% |
| Total | 100% |
Implication: Even modest upgrades to the active parts—better laminations (e.g., 0.27 mm vs 0.50 mm), higher slot fill, lower‑loss resin systems, tighter inductance matching, improved balance—can yield lifecycle gains that dwarf the 5–15% upcharge you pay upfront.
Failure and degradation mechanisms that move the needle
- Insulation thermal aging: Each 10 °C lower hot‑spot approximately doubles insulation life (rule‑of‑thumb Arrhenius behavior). Premium stator windings and cooling management reduce ΔT.
- Vibration & balance: Poor balance excites bearing and frame modes, increasing mechanical wear and partial discharge activity at end windings. Specifying ISO 21940 G2.5 (or better where feasible) meaningfully cuts risk.
- End‑winding resonance: Proper bracing, surge ropes, and resin stiffness prevent fretting and strand breaks under electromagnetic forces at load transients and faults.
- Rotor risks: For wound‑field rotors: turn‑to‑turn shorts, retaining ring stress corrosion (if applicable), and pole‑to‑rim loosening on salient machines. For PM rotors: magnet demagnetization margins and sleeve integrity (Inconel/titanium/CF).
- Moisture & contamination: VPI resins with good dielectric retention and sealed terminal schemes pay back in wet or chemical environments.
Quantified ROI levers tied to stator/rotor choices
Efficiency gain (0.5–1.0 %-points)
Lower core loss (finer laminations, premium steel), higher slot fill, and symmetrical phase inductance reduce electrical loss. Over 7,000 h/year, a 0.7 %-pt improvement on a 2 MW machine yields roughly 75 MWh/year more electricity for the same fuel—worth ≈ $9,000/year at $0.12/kWh.
Thermal margin
Better thermal path and Class H components can cut hot‑spot by 8–15 °C, extending time‑to‑rewind and allowing higher continuous rating without compromising life.
Balance & mechanical integrity
Balancing quality and rigid end‑winding support reduces bearing wear and the incidence of forced outages. Even a 0.1% change in failure probability per year matters financially at high downtime costs.
Longer maintenance intervals & faster major service
Clean winding geometry and accessible terminals shave service hours; on large machines, every saved day can be >$10,000 in avoided contractor and crane time alone.
Condition monitoring enablement
Embedding PT100/1000 RTDs, vibration probes, and partial‑discharge couplers in the active parts provides earlier warnings, avoiding secondary damage and shortening outages.
Worked example: 2.5 MVA CHP alternator (industrial site)
Use case: 2.5 MVA, 11 kV synchronous generator on a gas‑engine CHP line.
Electrical rating at PF 0.8: 2.0 MW.
Average load: 1.5 MW.
Operation: 7,000 h/year.
Electricity offset value: $0.12/kWh (blended).
Discount rate: 8%. Horizon: 10 and 20 years.
Option S (Standard active parts)
• Generator efficiency (nameplate/typical): 97.8%
• O&M: $0.004/kWh
• Probability of a rewind + associated downtime within 10 years: 25%
Option P (Premium stator & rotor package)
• Generator efficiency (typical): 98.5%
• O&M: $0.0037/kWh
• Probability of rewind + downtime within 10 years: 10%
• Incremental CAPEX: $60,000 (active‑parts upgrade only)
Assumptions for major event
• Rewind + consumables + crane + testing: $150,000
• Downtime value (lost production, logistics): $80,000 (≈ 10 days at $8,000/day)
• Expected event cost difference over 10 years: (25% − 10%) × $230,000 = $34,500, occurring mid‑life (Year 7 for modeling).
Annual performance and cost
Average mechanical input to produce 1.5 MW at 97.8% ≈ 1.534 MW.
With 98.5% and the same mechanical input, electrical output rises to 1.511 MW.
Extra energy from Option P: ≈ 75.15 MWh/year.
Value of extra energy (at $120/MWh): ≈ $9,018/year.
Annual O&M, Option S vs Option P: $42,000 vs $39,128 → $2,872/year saved.
ROI summary table (10‑year horizon, 8% discount)
| Metric | Option S | Option P | Delta (P − S) |
| Nameplate efficiency | 97.8% | 98.5% | +0.7 %-pt |
| Annual energy out (MWh) | 10,500 | 10,575 | +75 |
| Value of extra energy ($/yr @ $120/MWh) | — | $9,018 | +$9,018 |
| O&M cost ($/yr) | $42,000 | $39,128 | −$2,872 |
| Recurring savings ($/yr) | — | — | $11,890 |
| PV of recurring savings (10 yr, 8%) | — | — | $79,785 |
| Expected event cost (PV @ Year 7) | $33,551 | $13,420 | −$20,131 |
| Incremental CAPEX | — | — | −$60,000 |
| NPV (10 yr, 8%) | — | — | +$39,916 |
| IRR (expected‑value cash flows) | — | — | ≈ 19.8% |
| Discounted payback | — | — | Year 7 (expected value) |
Interpretation: On a 2 MW‑class CHP application, premium generator stators and rotors deliver a positive 10‑year NPV of roughly $40k with an IRR near 20%, even before considering soft benefits (smoother process quality, compliance margin, and better condition‑monitoring signals).
Over 20 years, event probabilities widen (e.g., 50% for Option S vs 20% for Option P), and recurring savings compound:
• PV of recurring savings (20 yr, 8%): ≈ $116,741
• Expected event‑cost PV (Year 12): $27,401 advantage for Option P
• NPV (20 yr) after $60k upcharge: ≈ $84,142
• IRR (20 yr): ≈ 21.8%
Sensitivity: When does the upgrade pay back?
Recurring savings hinge on operating hours and the value of electricity. The table below shows annual recurring savings and their 10‑year PV (8% discount) for different hours and prices—excluding major‑event avoidance (add ~$20k PV over 10 years if your event risk aligns with the example).
| Hours/year | $/MWh | Annual recurring savings | PV over 10 years |
| 4,000 | 80 | $5,076 | $34,065 |
| 4,000 | 120 | $6,794 | $45,592 |
| 4,000 | 160 | $8,512 | $57,118 |
| 7,000 | 80 | $8,884 | $59,614 |
| 7,000 | 120 | $11,890 | $79,785 |
| 7,000 | 160 | $14,896 | $99,957 |
| 8,000 | 80 | $10,153 | $68,130 |
| 8,000 | 120 | $13,589 | $91,183 |
| 8,000 | 160 | $17,025 | $114,236 |
Rule of thumb: If you operate >4,500 h/year or your electricity value > $0.12/kWh, energy + O&M savings alone usually justify the active‑parts upgrade; reliability/downtime benefits then become upside.
Standby and intermittent‑duty plants: ROI shifts to risk
For standby sets (e.g., ≤ 200 h/year), energy savings are small. The case for premium generator stators and rotors is still strong when:
- The cost of an outage during a grid failure is high (pharma batches, smelters, data‑adjacent operations).
- You need assured start capability and the lowest probability of in‑event failure (thermal margin, surge withstand, and balanced rotors matter).
- Access constraints mean a rewind or rotor extraction is logistically expensive (rooftop plants, islands, tunnels).
A simple threshold check:
(Avoided outage hours × outage $/hour × Δ probability of failure over horizon) > Incremental CAPEX.
With 8 avoided hours × $20,000/h × 5% probability delta ≈ $8,000 expected value, you’ll want either more hours, a higher dollar impact, or a longer horizon to break even—many critical sites easily exceed those numbers.
Practical specification choices that improve ROI
Use this checklist when discussing designs and quotes. Each item has a direct path to lifecycle value.
Core & loss package
- Lamination thickness ≤ 0.30 mm with low specific core loss at operating flux density.
- Precision stacking and stress‑relief anneal to avoid local hotspots.
Winding & insulation system
- Target Class F/H insulation with hot‑spot margin ≥ 10 °C at your continuous rating.
- VPI (or proven trickle) with resin system rated for your environment (chemicals, moisture).
- Inductance matching within ±3% phase‑to‑phase to reduce circulating currents and loss.
- Surge withstand and turn insulation validated to your switching environment (VSD/AVR transients).
Mechanical integrity & balance
- Balance to ISO 21940 G2.5 (or tighter when feasible); document overspeed testing and balance planes.
- End‑winding bracing designed against electromagnetic forces at worst‑case fault current.
Cooling & sensing
Provisions for RTDs/thermistors in hot‑spot locations; airflow mapping to cap ΔT.
If washdown/harsh duty: IP65 or better for relevant interfaces; sealed terminal box.
Rotor specifics
- Wound‑field: retaining rings and pole fixings verified for stress/corrosion in your environment.
- PM machines: sleeve material and demagnetization margins at fault/over‑temperature scenarios.
Quality & test regimen
- Factory tests to IEC/IEEE standards (surge, hi‑pot, PD where applicable), plus a witnessed heat run.
- Documented PD levels (MV machines), vibration spectra, and inductance balance at delivery.
Procurement traps to avoid
- Price‑only comparisons: A “cheaper” alternator with weaker stator/rotor design can cost more by Year 5 through energy loss and downtime. Ask vendors to monetize loss differences at your run hours.
- Ignoring load profile: Efficiency at nameplate often hides part‑load behavior. If you live at 50–75% load, ask for guaranteed part‑load losses.
- Under‑spec’d balance and bracing: Vibration damage is cumulative; fixing it later is far costlier than buying balance quality upfront.
- Sparse documentation: If you cannot see PD data, inductance matching, or balance records, you are probably absorbing the risk.